For years, purveyors of fine Wi-Fi systems the world over have spoken about the dreaded “Netflix Effect” in hushed tones while in dark corners.
Actually, I have no idea where or how they talk about it and I’m not even sure if it’s an official name or not. I am given to hyperbole and took full license while writing that first sentence. Oh well, my blog, my rules! In what needs to be an actual serious discussion that I can’t start serious, it’s just not in my nature.
What is in the nature of Wi-Fi is the request to provide guest Wi-Fi. For some, this is a very dreaded request and usually met with angst and hand wringing. Guest are notorious for having wonky devices that are out of date and unwilling to admit that they need to pony up and purchase a new device that is up to some type of current standards. A great write up about that came from Lee Badman over at @wirednot and if so inclined, he offers a decent insight to the thinking of the Wi-fi administrator who is met with this request.
My goal in this effort is to gain a better understanding of what the network is subjected to, both wired and wireless, after the network, guest or otherwise, is deployed and users are let free to roam the nether reaches of the Interwebs looking at, and watching, everything that this freedom entails. Inevitably, the discussion always turns to some user in some random room trying to watch everything Netflix and, in the process, messing up the network for the critical, sometimes lifesaving equipment that is forced to share the AP with this media hog. I’ve heard about this taking place, and how administrators will always err on the side of the mission and life saving critical devices and make sure that Netflix guy in room 312 is forced to the kiddie pool of the Wi-Fi world as some sort of punishment.
Why not? This is a free service we are offering and he should be grateful we even let him put his feet in the water of the nourishing pool of Wi-Fi we have built. I have a much different take on this philosophy, and as part of the following work I want the reader to understand where my thought process was and my hypothesis on this phenomena. As such, I proposed to conduct some scientific research into the “Netflix Effect” to my co-workers and they responded with the amount of apathy and non-interest that I expected would come from a group of wired network engineers and architects. That’s fine.
A quick search to remind myself of the scientific method gave me my starting point and the process my work should follow.
Step 1 – Ask a Question
This seems like a pretty simple step so I boiled down my question to this. Can having Netflix users on your guest Wi-Fi negatively affect the WLAN environment, and in turn, congest the system to the point that mission critical and/or life saving devices can no longer function, in turn leading to loss of life and/or revenue?
Step 2 – Background Research
Most of this is anecdotal at best, this I will admit. A quick search of Netflix and Wi-Fi will turn up numerous hits about how important these two items are, especially in the world of hospitality. My best suggestion to prove this yourself is get a couple of Wi-Fi architects, engineers, and administrators in a room and just ask the question about how Netflix impacts the corporate WLAN. You better pack a lunch because you are going to be a while.
My own experience is during an online chat where one administrator/engineer/architect (in the world of Wi-Fi this generally ends up being the same people) basically said he will rate limit down his guest Wi-Fi so that it can’t impact the medical devices that are critical to support life in his environment. I totally get that, and understand why he errs on the side of caution when it comes to that, but my own belief drew me to this research.
Step 3 – Hypothesis
While heavy downloading can and will have a negative impact on a WLAN environment, my belief is that all operators of guest Wi-Fi networks greatly over-exaggerate the amount of this heavy downloading, and in turn, make changes and insert devices or mechanisms to throttle this activity in an attempt to prevent the negative impact from happening.
While most engineers don’t have the time to run full scale tests to prove this one way or the other; or given the latitude to run tests in an active environment like a hospital or corporation, Wi-Fi administrators/engineers/architects are given no choice but to institute these throttling measures.
My hypothesis is that this very act of trying to limit the impact of these devices is instead creating a greater impact on the overall health of the network, sometimes to the detriment of the corporate wired and wireless network.
Step 4 – Testing
The stated purpose of these tests are to discover the impact to both the wired and wireless network a single user has on a WLAN system. As such, I set up a test to measure what would happen as rate limits were applied in different increments. My testing set up is as follows: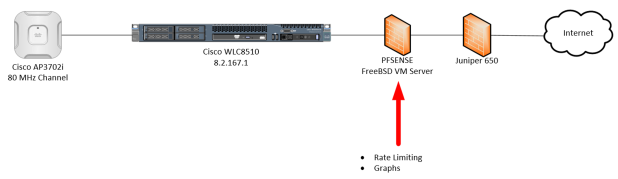
My goal here wasn’t to test in an environment loaded up with other devices, I wanted to know how a single device doing one primary thing watching videos, would impact the network both wired and wireless. Testing took place in my office with little to no other traffic on the AP. I used a single Apple iPad Pro, 802.11ac with 2 spatial streams and a Cisco WLAN infrastructure using a Cisco AP3702i, 802.11ac with 3 spatial streams. The backhaul was 1,000 Mbps to the Wireless LAN Controller (WLC) and through to the Juniper where it increased to 10,000 Mbps to the Wide Area Network (WAN) edge and the Internet Service Provider (ISP). Given this, the limiting factor (the slowest and least capable device) was the iPad. With these parameters, the best connection speed I could ever hope for was 866.7 Mbps between the iPad and the AP.
After getting my own dedicated VLAN and infrastructure between the WLC and the WAN edge, I ran a speed test to verify what I was getting.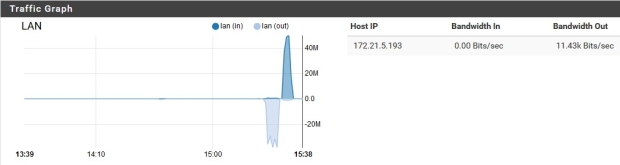
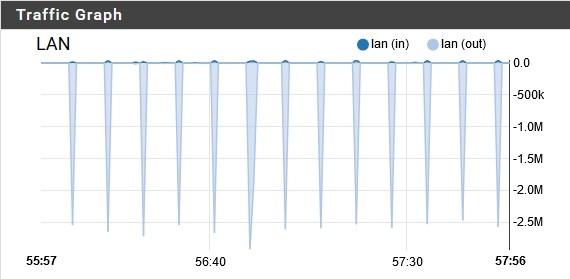
All of the graphs you are going to see were pulled from a pfSense firewall that acted as my firewall and all Layer 3 functions on my private VLAN. Also, these graphs are updated about every 1 or 2 seconds so they could update as fast as I wanted them to. Unfortunately, none of my other tools updated that much, so the resolution was much less. This does call into questions about what these graphs are showing, so let me walk you though it before we continue.
The X Axis of the graph is showing the minutes and seconds pulled from the firewall system clock. What you are seeing is not hours and minutes, but minute and seconds of the day. The time of this test was actually 06:13:39, not 1:39 PM. This will also indicate that this graph only shows 2 minutes of time. If you see a graph that starts, peaks, and then falls off all within the display, it means that event took 2 minutes or less of actual clock time.
The Y Axis of the graph shows the wired LAN utilization, but unfortunately there is a slight bug. The Y axis of the graph is off by a factor if 10. While the graph shows “40M”, meaning 40 Mbps, it’s actually 400 Mbps. Same with the lower section. I did confirm with later tests that the table on the right side does in fact show the correct utilization as the packets are flowing in real time, but not after the fact.
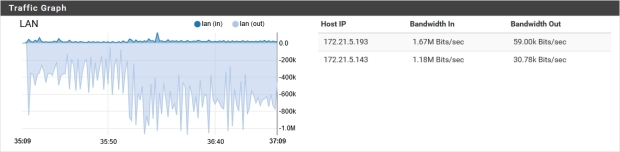
Speaking of the table on the right, this shows the current LAN traffic and the client IP involved. Depending on the direction of the traffic, upload or download, it will show the current speed of that traffic. This table is not historical, it only shows active traffic. If there is no traffic, that table will be blank. In those cases, I have removed the table in some instances so the graph can display bigger.
Lastly, this is displayed from the LAN side facing the client. Speed tests are run in the order of ping, then download, then upload. Download would then be the peak going down (lighter blue color on the graph) as data is sent to the client (downloading) and the upload would be the peak going up (darker blue color) as data is sent from the client (uploading). The table on the right shows “Bandwidth In” as traffic coming in the WAN port to the firewall and then out the LAN port to the Host IP (end user device) listed. “Bandwidth Out” shows traffic coming from the Host IP (end user device) and then out to the WAN. In the case of Netflix, and other streaming services, we really only care about the download since that is the direction of data flow (server to end user device).
Download Testing
In certain Wi-Fi environments, end users will ask their device (I’m not using “clients” since this term can be ambiguous) to download the video content in case they will be out of range or any type of connectivity for a while. In this scenario I was thinking airplanes, trains, buses, underground caves, those type of areas.
I wasn’t as concerned with the type of file being downloaded, more around the size of the file. Wi-Fi is Layer 2 centric meaning what is in the payload isn’t as much of a concern as the size of the payload in each frame and the size of the total file being requested by the end user of their device. For this test, I tried to stick with movies that were HD quality and around 1 hour and 45 minutes in length. Side note, have you ever tried to look on Netflix for movies to download using that criteria and not genre? Not as easy by the way.
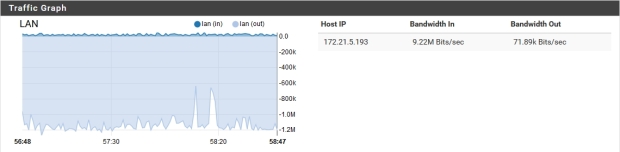
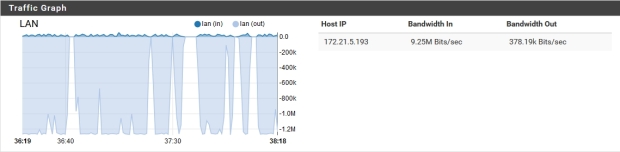
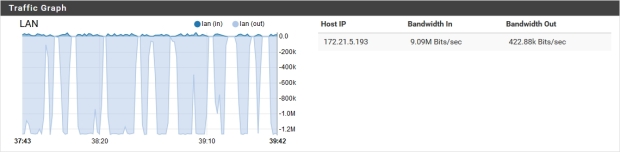
Netflix Download, No Rate Limit
Netflix Download, Ghostbusters 2, No Rate Limit
Netflix Download, Jurassic Park, No Rate Limit

Netflix Download, Despicable Me 3, No Rate Limit
Netflix Download, The Big Lebowski, No Rate Limit
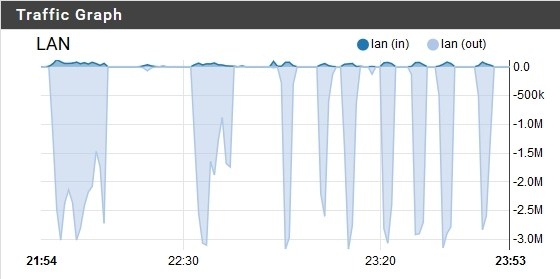
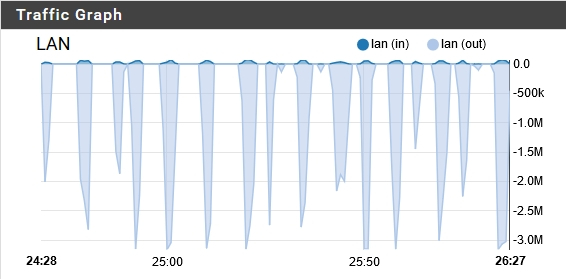
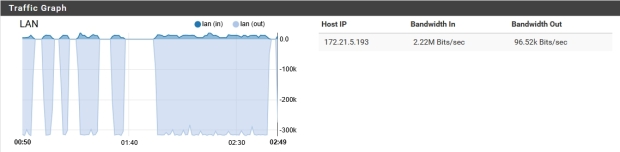
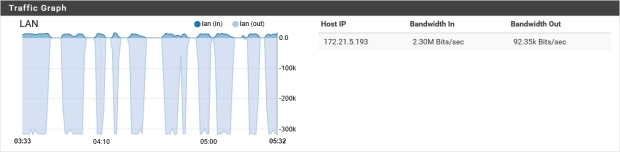
As you can see, these movies were mostly finished downloading to the tablet in about 2 minutes or so. Also of note is the Y Axis. Notice how it doesn’t peak at more than 90 Mbps? Earlier I confirmed that the device was able to do a speedtest at more than 400 Mbps, but here, in these tests, I was never able to crack even a quarter of that. There are any number of factors in play that could cause that but it wasn’t local to the network I could control. This is crucial because it shows that even though you don’t institute a rate limit function internally, external forces are doing it for you.
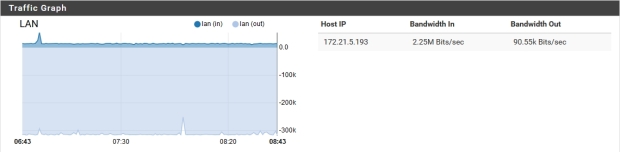
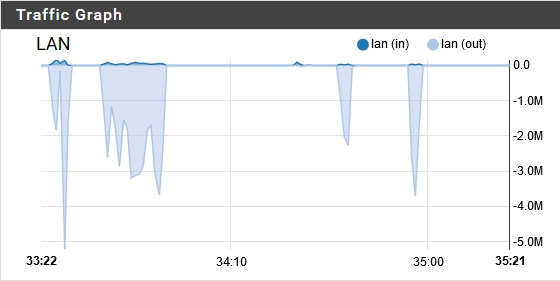
Netflix Download, 25 Mbps Rate Limit
Netflix Download, Tomb Raider, 25 Mbps Rate Limit
Netflix Download, Black Hawk Down, 25 Mbps Rate Limit
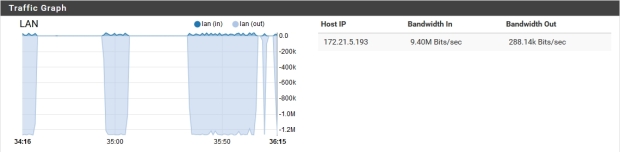
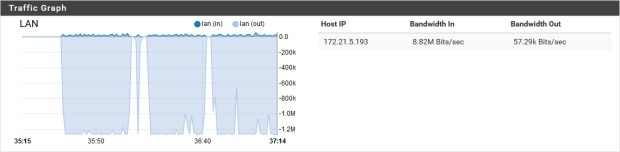
As you can see, the Y Axis has adjusted to match the rate limit, the time to download the file is now longer, and as proof of the bug I mentioned earlier on the Y Axis, you can see the actual rate that the client is getting at that second on the right side, not the smaller number on the Y Axis. However, we still get to see the spikes in the throughput that we like to see in a well performing network. This is critical later, so remember this.
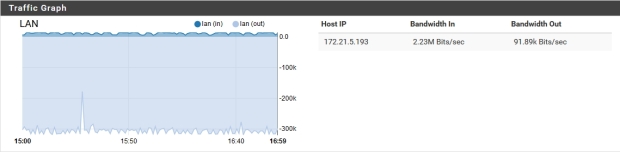
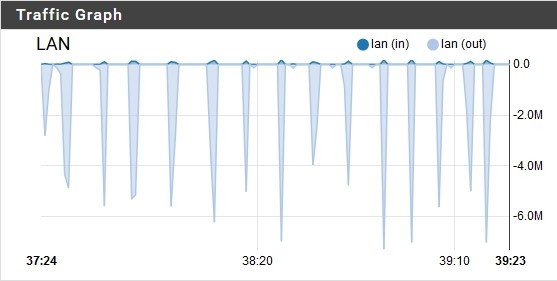
Netflix Download, 10 Mbps Rate Limit
Netflix Download, Raiders of the Lost Ark, 10 Mbps Rate Limit
Netflix Download, Raiders of the Lost Ark, 10 Mbps Rate Limit
I think you can see where this is going. I know I did. File is taking longer to download, the spikes are flattening out, and I was getting bored.
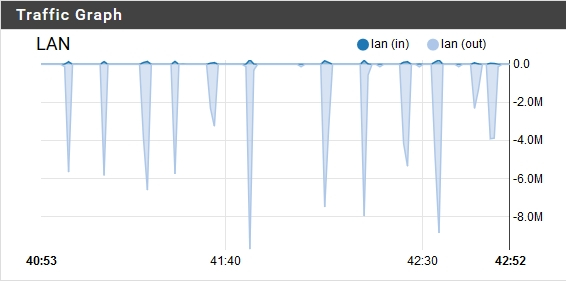
Netflix Download, 2.5 Mbps Rate Limit
Netflix Download, Jay and Silent Bob Strike Back, 2.5 Mbps Rate Limit
Netflix Download, Jay and Silent Bob Strike Back, 2.5 Mbps Rate Limit
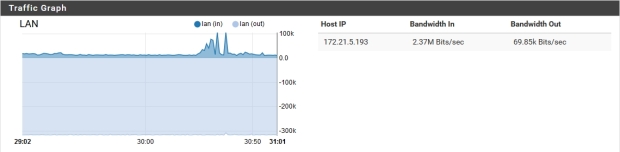
Netflix Download, Jay and Silent Bob Strike Back, 2.5 Mbps Rate Limit
As you can see, the graph gets really flat, and the length of time to download movies gets longer. Due to the linear path of the testing, I felt like this was a waste of my time, and my graph of the data backs me up. At least I think it backs me up: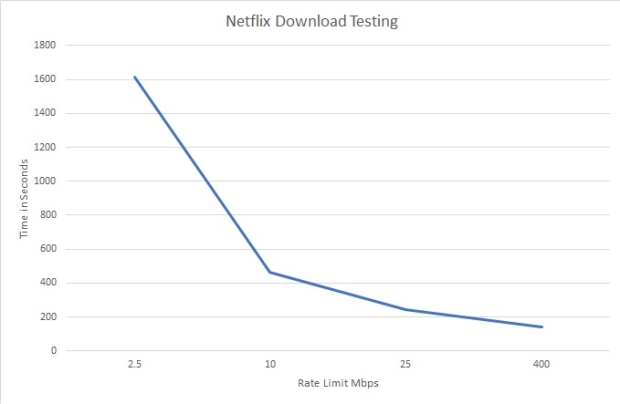
What this tells me is the more I rate limit (on the let side of the graph) the longer it takes me to download a file, video or otherwise. The less I rate limit, the quicker I get a file.
Before moving on, I really want to call out 2 things that jumped out at me in looking at this.
- There isn’t a big deal of difference in time it took to download the movies between unlimited and the 25 Mbps rate limit. At 10 Mbps it increases as expected, but the time it takes at 2.5 Mbps is massive!
- If you have to rate limit, try to keep it above 10 Mbps. 25 Mbps would be better, and as you can see, not that much different than no rate limit when it comes to downloading videos from Netflix. If management asks to implement a rate limit, lobby for 25 Mbps. If you have to negotiate with management, try to keep it above 15 Mbps.
Streaming Testing
For the download testing, the premise was end users were going to ask their device to pull a full video file from a remote server to store on their device so they could view that content at a later date. You remember, the underground cave scenario.
After getting bored with download testing and the predictable results, I quickly shifted to the other scenario, people bored in a captive location (airport waiting on delayed flight, hospital waiting room, hotel rooms) and wanting to consume the video content “on the fly” if you will. Also known as streaming.
Using the same set up as before, with the same device and WLAN configuration, I switched from downloading content to streaming content.
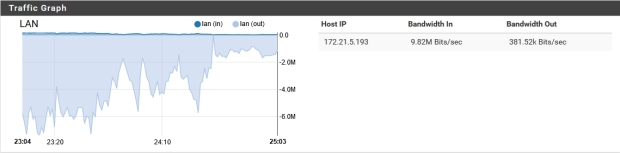
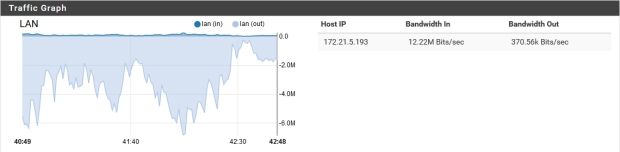
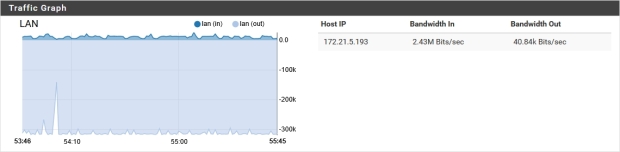
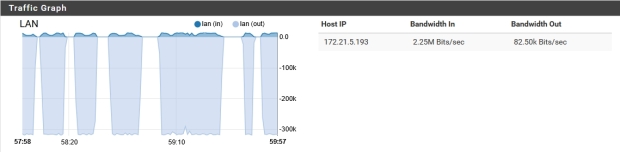
Netflix Streaming, No Rate Limit
Netflix Streaming, Monty Python and the Holy Grail, No Rate Limit
Netflix Streaming, Monty Python and the Holy Grail, No Rate Limit
Netflix Streaming, Monty Python and the Holy Grail, No Rate Limit
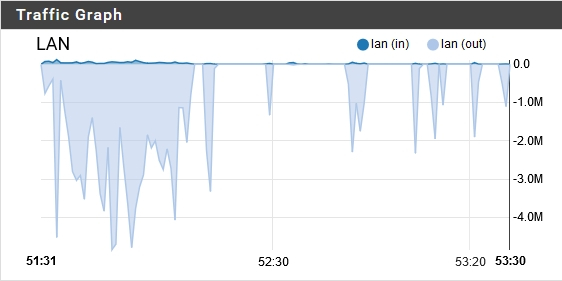
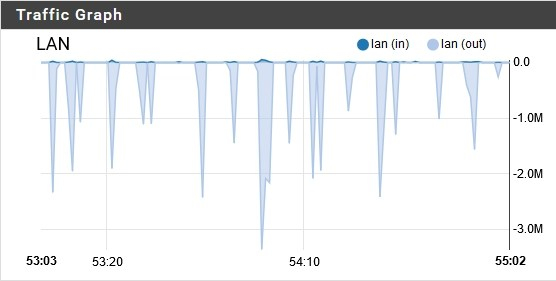
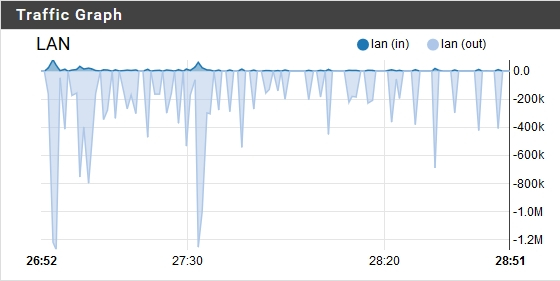
As you look through the three graphs, you can see the time move as I watched the movie. The other thing I found interesting that I will point out on the first graph is what I call the setup period. This is where the device is pulling the first bit of content down to the device to buffer. The set up data and then the first pull of data was interesting, and then it settled down to a routine pattern. Every 20 seconds or so, as the buffer on the device was depleted by playing the video on the screen, the device would go back to the well, so to speak, to top of.
Lot’s of spikes. Narrow and a lot, that is a very efficient network at this point. Also, notice that it peaks at about the same rate as the download? It never gets above 100 Mbps even though the speedtest was still showing 400 Mbps. Something outside the local network was limiting my device. Also, the more data my device received at one time, the longer the gaps between the data requests was. This is crucial when the conversation turns to clock time. More on that later.
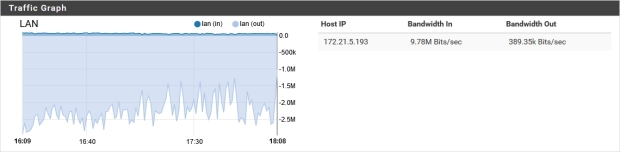
Netflix Streaming, 25 Mbps Rate Limit
Netflix Streaming, National Treasure, 25 Mbps Rate Limit
Netflix Streaming, National Treasure, 25mbps Rate Limit
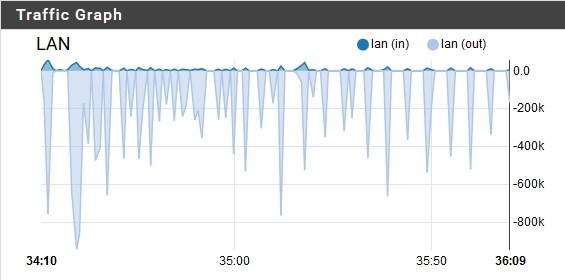
As expected, as the rate limiter came down, the throughput decreased accordingly. There is still the set up period that was seen in the first streaming test.
What struck me was the width of the spikes and gaps between them. Also, pay attention to the number of spikes. The width of the data spikes are increasing and taking up more time on the resource while the width of the gaps, the white spaces of unused time, was getting smaller. Also, there are more requests of time on the resource (more data spikes.) This means the device is needing to refill it’s buffer more often because it didn’t get as much data per request as before.
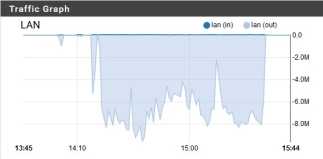
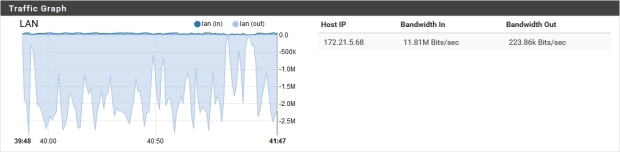
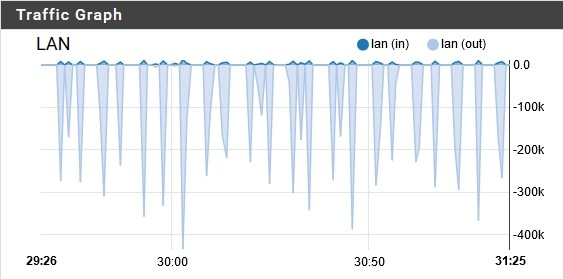
Netflix Streaming, 10 Mbps Rate Limit
Netflix Streaming, The 6th Sense, 10 Mbps Rate Limit
Netflix Streaming, The 6th Sense, 10 Mbps Rate Limit
Netflix Streaming, The 6th Sense, 10 Mbps Rate Limit
Netflix Streaming, The 6th Sense, 10 Mbps Rate Limit
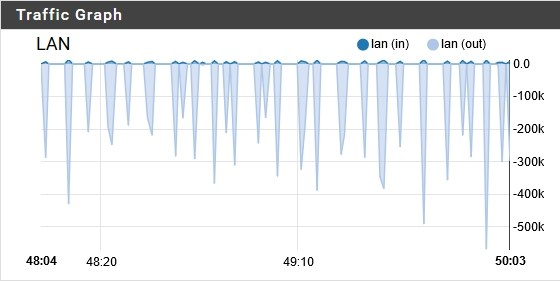
The set up period is still there, but took so much longer! The number of individual spikes has decreased with the lower throughput, but the width of the data spike has jumped incredibly!
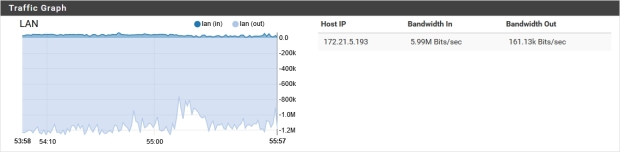
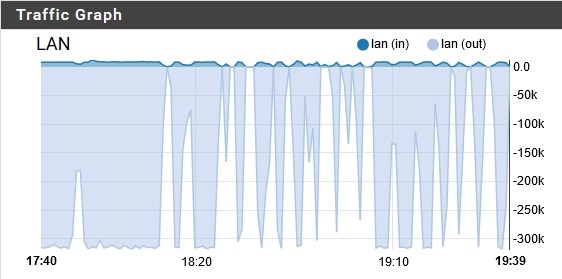
Netflix Streaming, 2.5 Mbps Rate Limit
I will warn you ahead of time, this is crazy.
Netflix Streaming, Star Wars: Rogue One, 2.5 Mbps Rate Limit
Netflix Streaming, Star Wars: Rogue One, 2.5 Mbps Rate Limit
Netflix Streaming, Star Wars: Rogue One, 2.5 Mbps Rate Limit
Netflix Streaming, Star Wars: Rogue One, 2.5 Mbps Rate Limit
See those huge blocks of blue? That is the amount of time that the LAN was spending sending data to the device. Every second of that block. We no longer see the spikes, we see blocks. Spikes in the network are good, flat tops are not. That means things aren’t working efficient and there is an issue. That issue could either be a router, switch, or firewall, or ports on any of them, that is overloaded. It could also be what I did here, institute an artificial rate limit “to protect my wired infrastructure.”
Notice I put that in quotes.
If this is what one device does to the network, what would a second device do?
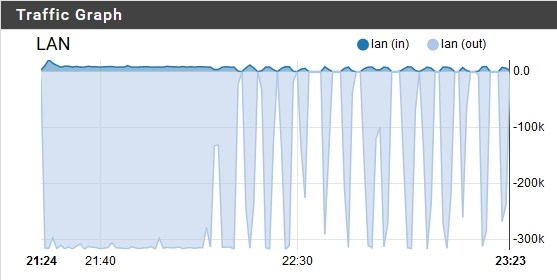
Netflix Streaming 2 Clients
Netflix Streaming, 2 clients, 25Mbps rate limit
At 25 Mbps, we can see the session set up as before as it spikes up to about 50 Mbps (2 clients at the same time both at 25 Mbps) but then, as they start to stream, the Y Axis changes.
Netflix Streaming 2 clients 25Mbps rate limit
This part is critical to understand, so I want to pause to make sure this makes sense. What we see in the first graph is the 2 clients that started streaming at almost the same time (me sitting in front of 2 device and trying to time it.) After that initial set up period, it almost reverts back to what we saw in the single client test. Spikes that don’t exceed 25 Mbps (for the most part) and at about the same width on the X Axis. The difference between the 1 client test and the 2 client test is the number of spikes. What has happened is the devices have settled into a routine where when one device is refilling it’s buffer, the other device isn’t requesting access to the resource.
In the case of what we are viewing, it’s a wired resource. Since this is a wireless device, however, we can safely assume that this transfers to the wireless resource as well. While one device is refilling it’s buffer, the other device is quietly playing it’s video. This gives that device it’s own time on the air to get the requested data, without having to share it with the other device.
See, what is of the most importance in all of these graphs isn’t the blueish parts showing data being consumed, it’s the white spaces in between! Those white spaces represent time, and even with all of our knowledge and expertise, the one factor that we haven’t been able to manipulate yet is time. Preserving time, our most precious resource that the FCC can’t grant us more of, should be of the highest priority. People sitting in these locations (hospitals, bus stations, airports, hotels, underground caves) are always going to want the resource (video content) no matter what we do as administrators to limit that.
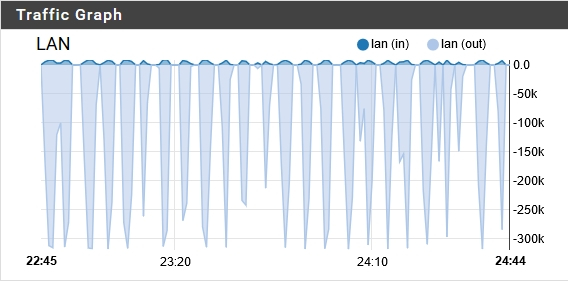
Let’s see what happens when we tighten the limits even more by taking it to the extreme.
What I did for this test was to start a client streaming, and then start the second client. What I’m trying to show here is that unlike the 2 client, 25 Mbps test previously where they slotted between each other in the open white space of available time, the demand on the resource aggregated. No longer are they sharing the resource (wired and wireless time) they are constantly needing access to the resource.
What about other streaming services?
After using Netflix for a while, I wanted to see how other services compared. As you know, Netflix isn’t the only service people use to consume content. So I switched over to YouTube.
YouTube Streaming, No Rate Limit
YouTube Streaming, No Rate Limit
YouTube streaming is such a different beast than Netflix. Content can be a mix of professionally edited, HD videos and amateur cell phone clips. The graph above shows a random video that was suggested by YouTube. More spikes, a little bit wider, and not as much data transferred per buffer refill. 5 Mbps compared to the 50 to 80 Mbps seen in Netflix streaming with no rate limit. Less data transferred (rate x time) means more time going back to the resource.
YouTube Streaming, 25 Mbps Rate Limit
YouTube Streaming, 25 Mbps Rate Limit

YouTube Streaming 25 Mbps Rate Limit
What you can notice here is that there isn’t much difference between no rate limit and a rate limit 25 Mbps. This coincides what was seen on Netflix.
YouTube Streaming, 10 Mbps Rate Limit
YouTube Streaming 10 Mbps Rate Limit
YouTube Streaming 10 Mbps Rate Limit
With a rate limit of 10 Mbps, it’s pretty much as we have come to expect. A little wider spikes, a little more of them, and less white space between them. The difference between no rate limit and a rate limit of 10 Mbps is almost negligible, almost to the point of saying they are the same. Seeing as YouTube isn’t feeding the data to the client at faster than 10 Mbps, this would be right on par.
YouTube Streaming 2.5 Mbps Rate Limit
YouTube Streaming 2.5 Mbps Rate Limit
YouTube Streaming 2.5 Mbps Rate Limit
At 2.5 Mbps of rate limit, we see the same thing as Netflix. An almost constant demand on the time resource, all the while still not pulling a ton of data on each request. Add in a second user streaming Youtube and you can imagine how those white spaces representing time just go away, meaning that a third user would then start to aggregate the speed needed to serve the three clients.
Last service I had available is now known as AT&T TV, a streaming service for cord cutters that still want to watch channels that are normally a cable subscription.
AT&T TV Streaming, No Rate Limit
Their service is so “great” that I was worried about adding a rate limit in, so didn’t. What I will tell you is I got so pre-occupied with what I saw that I got sidetracked for a day or two. Unlike the other services, this graph is super organized and symmetrical. It also pulls almost the exact same amount of data on each request, which is different than the other services. Since they pull the data more infrequent than the other services, imagine what happens to that stream that you are watching if that one time the device goes to refill it’s buffer, it can’t for some reason? The content would time out on the stream and start to jitter. From personal experience I can tell you this happened to me more times than I could count. The reasons for the missed buffer refill could be any reason that causes Wi-Fi to be contentious. More on that later.
Step 5 – Analyzing the Data
(Admit it, at this point you forgot I was following the scientific method. Don’t worry, so did I.)
Now, at your house or Small to Medium size Business (SMB), this may not be of a great concern. What I need you to do next is to extrapolate this with me to a much larger client count that you may see at large public venues or hospitality or healthcare.
Think hundred to thousands of end users, all with their devices, wanting to consume content. Next, think about the intent of the end user (not to be confused with “intent based networks.) Will these users be downloading or streaming? Will the majority of the streaming be from Netflix or YouTube, or another service? Next, think about the trigger events. What are the odds of all thousand users starting their stream or download at the exact same time? This gets into Erlang’s probability formulas that I spoke about in my over subscription blog. Didn’t read that one? I don’t blame you, it’s a long one! Read on for a “TL:DR” refresher.
Erlang’s probability formulas involve random access to a medium. Originally built to predict phone trunks between large cities, it is used to determine how many trunks are needed to support calls outside of the local area under the assumption that not everyone makes a phone call at the same time, and even then not everyone is going to call outside their local area. In the old days think about being able to call your friend across the street but not your grandparents in the next state. In Wi-Fi, not everyone will be accessing the network at the same time, and they won’t be doing the same thing. There are events that break this rule for both phone and Wi-Fi scenarios, but can be used in most scenarios.
When networks get into these “high demand” areas, preserving those white spaces of time become super critical. Are your end users wanting to download content for later? Get it to them as fast as possible. Are your end users wanting to stream content “on the fly”? Get it to them in a manner that preserves that white space so they can slot between each other on the time spectrum, not aggregate up the speed spectrum. As you get larger, aggregation is going to happen but the quest is to keep it from aggregating until we can’t help it anymore. At least at that point we know we have used the time as efficiently as possible before we try to start stress testing those new Multi Gigabit Ethernet switch ports your sales person sold you.
In both testing scenarios, we saw that something outside the local network was keeping the device from pulling it’s full potential. Also, there are also things inherent to Wi-Fi that keeps the service in check. Everyone knows that Wi-Fi isn’t very efficient and that even if we are connected at 866.7 Mbps (802.11ac, 2 spatial streams, 80 MHz wide channel, short guard interval, VHT MCS 9) we will never see that in real life. Some other basics that sometimes we forget.
From Certified Wireless Network Professionals (CWNP) Certified Wireless Network Administrator (CWNA) training, and demonstrated by Joel Crane at Wireless LAN Professionals Conference (WLPC) in 2018, Wi-Fi is still half duplex.
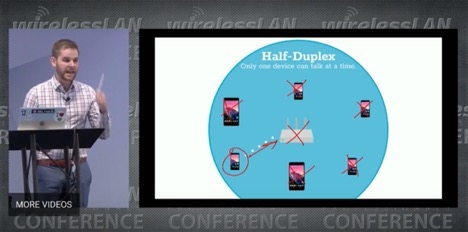
“Half duplex I say!”
I love Joel, and I’m so happy that he lets me use this screen capture from his presentation. Even at the most recent standard of 802.11ax (as of this writing) only one device can talk at a time on any given space of spectrum. In the case of 802.11ax it’s a smaller chunk of the spectrum than 20 MHz, but still it’s own chunk. How does that one device get to be the only device transmitting at that time? No worries, I got you covered on this one as well.
The great Peter “Magic Packets” Mackenzie from MarQuest taught my CWNP Certified Wireless Analysis Professional (CWAP) class and shared this with us. This is what is known as the Distributed Coordination Function, or DCF.

Thanks to Peter for allowing me to use this chart. If you have never seen it, this is what is required for any one device to send a frame on a channel. The AP is treated as a device on the channel, so it has to play this game as well. Remember my comment about the way AT&T TV has their buffering running from earlier?
**Disclaimer – This chart has been somewhat skewed with the new OFDMA technology introduced to Wi-Fi with 802.11ax, but until we (IEEE) finally decide to deprecate 802.11b (DSSS) from the standard, you get the picture.**
Between 802.11 inherent limits, remote server capabilities, half duplex, and DCF, there are already mechanisms in place that keeps end users from claiming all of the resource and not allowing that critical piece of life saving equipment to get their one frame through.
Some Points That I Take Away
I copied the 2 from above, because I want to reinforce them before I add on additional points before I wrap this up.
- There isn’t a big deal of difference in time it took to download the movies between unlimited and the 25 Mbps rate limit. At 10 Mbps it increases as expected, but the time it takes at 2.5 Mbps is massive!
- If you have to rate limit, try to keep it above 10 Mbps. 25 Mbps would be better, and as you can see, not that much different than no rate limit when it comes to downloading videos from Netflix. If management asks to implement a rate limit, lobby for 25 Mbps. If you have to negotiate with management, try to keep it above 15 Mbps.
- Rate limits below 10 Mbps, even down to 2.5 Mbps, are a disastrous setting. I’m looking at you, un-named airport service provider in many airports across the United States. End users are still going to ask their device to get that data before they get on the plane, or want to stream content while waiting during any number of delays routinely encountered. Settings that low cause ALL of the devices to aggregate their demand on the resources, no matter downloading or streaming. In one certain event, I actually saw the enforced rate limit cause problems on the wired infrastructure.
- We need to do everything in our power to preserve the white space that we saw in all of these graphs. Whether it’s before or after the download starts, or in between the device buffer refills, that time is precious and we can’t get it back.
- Clock time, the amount of time a device spends requesting a resource, is not the same as airtime. Many people believe that airtime utilization is what I’m trying to point to, but it’s not. Airtime utilization is something that we can measure using a myriad of tools, and as things aggregate, it can become a concern. I’m not saying that it’s something we need to forget about, but it can be an indicator of something else, like rate limiters, somewhere else in the network.
- Rate limiting by turning off the low MCS rates is not a good idea. This isn’t the rate limiting that I’m referring to at all! Turn off some of the lower 802.11b/g data rates and raise the Minimum Basic Rate (MBR) at your own (slight) peril, but leave all the MCS rates alone. Remember, at least with 802.11ac, a single slice of time for the channel is required to send one frame. We want it sent at the fastest we can (highest MCS rate) no matter if the payload is 32 bytes or 1,500 bytes.
Step 6 – Communicate the Results
This seems a little redundant at this point of my blog post/white paper, but I am trying to follow the scientific method! This is something that I have been working on for some months now, and the initial results were so intriguing (rate limiting a streaming device below 10 Mbps uses almost as much time on the resource as a download) that I actually did a presentation at WLPC 2019 around this same topic, even using some of the same graphs.
The difference is during the presentation I only had 10 minutes to cover everything so I didn’t have the time to go into as much detail as I did here. Oh, and I was feeling terrible at the time.
Like I said at the end of my presentation, as with everything else in Wi-Fi, turning off an existing rate limiter on a network can be scary. Should you do it? That’s not a question I can answer, nor did I intend to answer it here. Each deployment is different, and each end user base is different, and all of that has to be considered when making decisions like this. Like I covered in my over subscription blog, classrooms can break this since they really do have a trigger event of an instructor telling all the students to download or stream a video at the same time.
Should you institute a rate limiter on a new deployment? I can’t answer that either. What I can say is that if you are working on networks that are bigger than SMB, take the time to understand the way the end users are going to want to utilize the network or not, even if they say they never use Netflix or YouTube. They do, everyone streams content these days. Even some companies are using streaming services for online training, and with all wireless offices increasing, this is definitely a concern.
My goal for this testing is not to get you remove your rate limiters so you need to buy a bigger pipe from your ISP, it’s actually the opposite.
If your current rate limit settings are too low, it can drive up the demand on the internet pipe, leading you to believe that you need a bigger internet pipe. Remember that whole aggregating part from earlier? If you can get clients to slot between each other in the demand for the internet pipe, instead of aggregating together on the pipe, you don’t need as big of a pipe. Smaller pipe means less money paid to your ISP. Lower costs means maybe you can stop trying to sell advertising on a captive portal and make all of your end users happy!
That’s it! We are done! No more steps in the scientific method. If you made it this far, then I thank you so much! As always, I know that I not infallible, so if you see something in this that you want to discuss or question, please do so.
